Navigating the volatile waves of cryptocurrency requires more than luck—it demands skill and precision. To make educated trades, you need to know how to use crypto charting tools. You’re about to learn methods that turn confusion into clarity. With a firm grasp on crypto charts and indicators, you’re laying the groundwork for success. Understanding candlestick patterns and volume is just the start. Soon, you’ll implement technical indicators, getting ahead with predictive insights. Get ready to dive deep into trend analysis, moving averages, and spotting crucial trading levels. Mastery of advanced techniques awaits, with Fibonacci and Bollinger Bands as your allies. And to pull it all together—customizing charts, backtesting, and real-time alerts will be your game changers. Let’s reveal the market mastery secrets that set successful traders apart.
Laying the Foundation: Understanding Crypto Charts and Indicators
Deciphering Candlestick Patterns and Volume Analysis
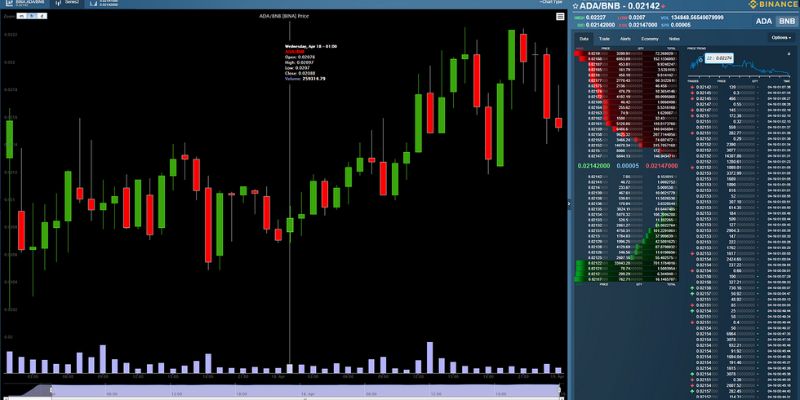
Start with candlestick patterns in crypto. These shapes tell a price story. Each one shows opening, closing, highs, and lows for the day. Green candles mean prices went up. Red candles mean prices went down. But there’s more in the wicks—a small body with long wicks signals indecision. A long body with short wicks shows strong buying or selling. Master these, and you’re decoding market emotion.
Next is trading volume analysis. Volume shows how many coins traded during a candle. High volume means lots of interest, possibly a strong price move. Low volume may signal a lack of interest or a weak move. Watch for changes. A volume spike paired with a price jump might mean the start of a trend. Or it could warn of a reversal if followed by a quiet period.
Implementing Technical Indicators for Predictive Insights
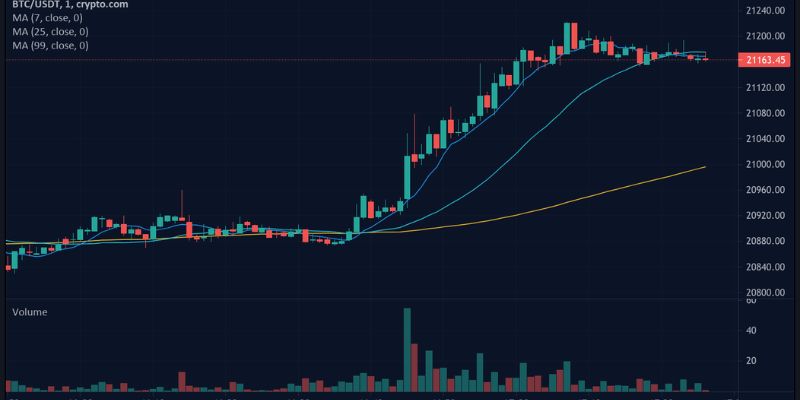
Now, let’s dive into technical indicators for crypto. They’re like secret codes for future price moves. First up, moving averages crypto traders love. They smooth out price action over days or weeks. A price above its average could mean “buy,” while below might suggest “sell.”
But which moving averages? The short-term ones react fast, showing quick trends. Longer-term averages move slow, but they filter out the noise. They can act as support or resistance too—key levels where prices might change.
Crypto technical indicators are here to help. The RSI, or Relative Strength Index, shows if something’s overbought or oversold. It ranges from 0 to 100—above 70 might mean it’s too hot, under 30 could say it’s too cold.
Bollinger Bands are cool too. Imagine a rubber band around price action. Price tends to stay inside—the closer to the edges, the more likely a snap-back is coming. The MACD indicator for crypto is a mash-up of moving averages. It tells us about the momentum and possible direction changes.
Fibonacci retracement levels bring old math to new tech. They suggest where prices may pause or reverse, after a big move. Giving you hints on where to enter or exit trades.
Use charting software for crypto to see it all. They offer drawing tools for crypto charting, help to plot cryptocurrency trend lines, and mark support and resistance crypto levels. Choose your time frames for crypto charting wisely—a day trader stares at minutes, while a long-term thinker watches days or weeks.
Get into crypto chart patterns. They’re like clues in a chart detective’s handbook. Spotting a “head and shoulders” or a “double top” can tell a tale of coming change before it hits the news.
Look, we’re just scratching the surface. All these tools share the same goal: to get you ahead of price action in crypto. Understand them, use them, and you’ll move from guessing games to educated trades. That’s the power of mastering crypto charting.
Mastering the Art of Trend Analysis with Crypto Charting Tools
Utilizing Moving Averages and Trend Lines Effectively
To grasp the flow of crypto prices, you must become one with moving averages. They iron out price data to show a clear path, shedding light on the hidden trend within the noisy market jungle. A simple moving average (SMA) takes recent price data and smoothes it into an easy line. It’s like a trail of breadcrumbs showing where the crypto has been.
Now, picture two SMAs on your chart: one short and one long. The short one races around quickly, responding to price changes in the blink of an eye. The long one moves slower, like a wise turtle, showing you the steady, longer trend. When these lines cross, pay attention! It could signal that the wind is changing direction, pushing the price trend with it.
Identifying Support and Resistance Levels for Strategic Trading
Diving into the support and resistance levels is like setting up a strategic game of crypto tug-of-war. Think of support as the floor; it’s where prices might bounce up. Resistance is the ceiling, where prices could get pushed down. These invisible barriers hold secrets that can make or break your trades.
Plotting these levels on your chart turns you into a trading architect. You see where the price has struggled or taken a break in the past. It’s where the bulls and the bears have had their biggest battles. When the price approaches these levels again, get ready for fireworks! Will the price smash through, or will it retreat? Watch closely and be ready to make your move.
Getting to know these tools means practice, and a lot of it. But once you do, you’ll read the crypto charts like they’re telling you their life stories, written in the lines and levels. This isn’t just data—it’s the heartbeat of the market, and you’ve got your finger on the pulse.
Use these tools right, and you’ll cut through the chaos with the precision of a ninja, carving out profits in the up-and-down world of crypto. Sure, there will be surprises. That’s part of the game. But with your charting toolkit in hand, you’ll step into the ring each day with confidence, ready to dance with the market’s every move.
Advanced Techniques: Trading Cryptocurrency with Precision
Incorporating Fibonacci Retracement and Bollinger Bands
Trading isn’t just luck; it’s a skill. And skills need sharp tools! Enter Fibonacci retracement and Bollinger bands – your secret weapons in the cryptocurrency game. Let’s start with Fibonacci. Picture this: prices go up and down, right? Fibonacci retracement levels are like invisible steps on a ladder that help you guess where the price might take a breather. These levels are super handy when a coin’s price skyrockets or plummets.
How do you use Fibonacci retracement? First, you pick a high point and a low point on your chart. Then, draw lines at percentages of that height. The lines often act like magic spots where prices might stop and reverse. It’s like the price action takes a moment to catch its breath before its next move!
And what about Bollinger bands? Imagine a road with your cryptocurrency price driving along it. The Bollinger bands are like lane markers. They show you how fast the price is driving and when it might swerve. If the price hits the top band, it might be time to sell. If it dips to the bottom one, it might be time to buy. The bands also can squeeze tight, hinting that a big price move is coming soon!
Leveraging the RSI and MACD Indicators for Enhanced Decision Making
Moving on to RSI and MACD indicators. What is the RSI indicator? It’s like a heart rate monitor for crypto. The Relative Strength Index (RSI) measures how fast prices are changing. When it’s too high, above 70, it means the market might just be too excited and due for a cool down. If it’s below 30, the market could be too gloomy, and a sunshine burst might be near.
MACD indicator? That stands for Moving Average Convergence Divergence. Fancy, huh? It’s like seeing two trains running on the tracks, showing you if they’re heading together for a happy meet or going separate ways, meaning a possible price trend change. It includes a histogram too, which is like a heartbeat showing the strength of the move.
Understanding crypto charts can feel tough. But with tools like Fibonacci retracement, Bollinger bands, RSI, and MACD, you’re not just guessing. You’re making smart moves based on what the market’s hinting at. Add these tools to your kit and watch your trading strategies level up.
Remember, though, these tools aren’t crystal balls. They’re parts of a much bigger puzzle. Use them smart with things you learn every day. Then, trading is not just random bets; it’s more like a sharp strategy game where you aim to win. Keep practicing, stay smart, and happy trading!
Charting Software and Strategy Optimization for Cryptocurrency Trading
Customizing Chart Setups and Exploring Various Charting Tools
Kicking off, let’s jump right into the thick of it. Customizing your chart setups in crypto charting tools can make a big splash. It helps you spot critical trends and patterns that spell success or doom. To craft a setup that sings, first pick a chart type. Candlestick charts are hot. They show price action in crypto like no other. You see highs, lows, and the fight between buyers and sellers—all at a glance.
Next, lay down some technical indicators. Moving averages are pure gold. They smooth out price data and can call out a trend like “Hey, look at me!” Fibonacci retracement levels? They’re like magic—marking where prices might pause or reverse.
Still with me? Great. Now, let’s talk time frames. If you like a fast game, go short. Like hours or minutes. For a long haul view, days or weeks is your beat. Just know this: your time frame shapes your trading style.
Drawing tools are your friends. Use them to drop lines that show support and resistance crypto zones. Why? Because these lines are where prices often take a break or bounce back. They’re your signal flags in a messy market.
Every tool has its own beat. Some are simple. Others are pro-level, with more dials than a jet cockpit. But hey, don’t sweat. Start simple. As you grow, level up your charting tool game.
Understanding crypto charts isn’t just smarts—it’s essential. Remember, the chart is your map. And you’re the captain of this crypto ship.
Backtesting Strategies and Setting Alerts for Market Movements
On to strategy. Backtesting is your crystal ball into the past. You test your trading strategy using historical price analysis crypto data. It’s like asking, “Hey, old plan, would you have won in the last race?” It won’t guarantee future wins, but it sure sharpens your edge.
Backtesting is all about learning. Did your calls line up with actual swings? What did you miss? It’s your own crypto playback. Dive into the data, tweak your moves, and come out swinging stronger next time.
And then there’s the art of staying alert. No, I’m not just talking coffee. Setting alerts in your charting software for crypto can save your skin. Price hits a certain point? You get a buzz. RSI indicator hits the red zone? Ding, your phone lights up. You catch the drift.
A good alert keeps you ahead of the game—you strike fast or bail before the storm. It’s like having a lookout in the crow’s nest while you steer the ship below.
Get this: Tools and alerts are no good if you’re not at the wheel. It’s your analysis, your calls. This, mate, is how you master those waves. You and your chart, making every trade count. And that’s the real secret—knowing your tools and making them work for you.
We’ve come a long way! First, we got smart on crypto charts and indicators like candlesticks and volume. These basics help us see what’s up with prices. Then, we dug into trend analysis, where tools like moving averages and trend lines show us market flow. We learned to spot key spots – support and resistance – that tell us when to jump in or out.
Next, we hit the advanced stuff. We saw how Fibonacci and Bollinger Bands sharpen our trade game. Plus, we found out how RSI and MACD can level up our choices big time.
Last, we checked out how to set up our charts and play with different tools. Backtesting strategies and setting alerts help us stay ahead of the game. The takeaway? When you chart right, you trade tight. Keep practicing, stay sharp with your tools, and you’ll trade like a pro.
Q&A :
What are crypto charting tools and why are they important?
Crypto charting tools are software applications or platforms that provide a visual representation of cryptocurrency market data, like price movements, trading volume, and market trends. These tools help traders and investors analyze the market, make informed decisions, and develop trading strategies by understanding historical data and identifying patterns.
How can beginners get started with using crypto charting tools?
For beginners, the first step is to choose a user-friendly charting tool and familiarize themselves with the basics, such as reading price charts, understanding candlestick patterns, and recognizing common indicators like moving averages. Many charting platforms offer tutorials and resources that can help beginners learn how to utilize the available features.
What are the key features to look for in a crypto charting tool?
When choosing a crypto charting tool, consider features such as a variety of chart types (line, bar, candlestick), a comprehensive set of indicators (RSI, MACD, Bollinger Bands), options for drawing tools (trend lines, Fibonacci retracement), real-time data, and a customizable interface. Advanced features might include backtesting capabilities, market alerts, and the ability to execute trades directly from the chart.
How can traders use technical indicators in crypto charting tools?
Traders use technical indicators within crypto charting tools to assess market conditions and predict potential price movements. Common indicators include trend indicators such as the Moving Average Convergence Divergence (MACD), momentum indicators like the Relative Strength Index (RSI), and volume indicators such as the On-Balance Volume (OBV). Traders apply these indicators to their charts to help identify buy and sell signals.
Are there any free crypto charting tools available for users?
Yes, there are several free crypto charting tools available, such as TradingView’s basic plan, which provides essential charting features, indicators, and drawing tools. Other platforms might offer a free version with limited access or a trial period. Free tools are a good starting point for beginners to practice charting before investing in more advanced, paid versions.

