Introduction to Fibonacci Retracement in Crypto Trading
In the volatile world of cryptocurrency trading, technical analysis tools are essential for identifying potential price movements and making informed decisions. Among these tools, Fibonacci retracement in crypto analysis stands out as a powerful method for predicting support and resistance levels. Based on the mathematical Fibonacci sequence, this tool helps traders identify key price levels where reversals or continuations are likely to occur. This article explores the mechanics of Fibonacci retracement, its application in the crypto market, and advanced strategies for leveraging it effectively.
What is Fibonacci Retracement?
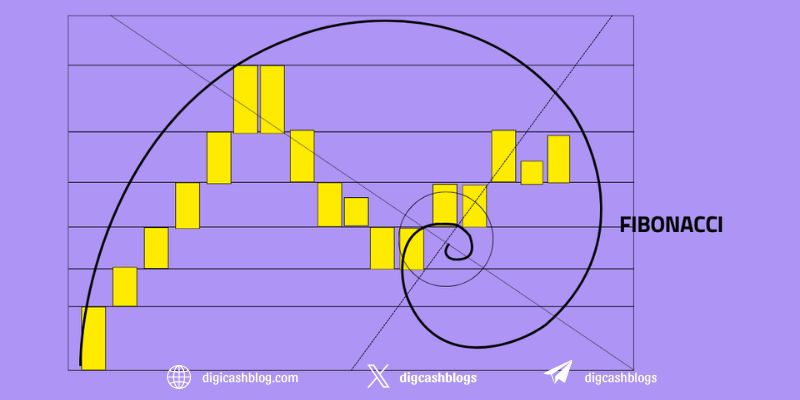
Fibonacci retracement is a technical analysis tool that uses ratios derived from the Fibonacci sequence to identify potential support and resistance levels in a price chart. The Fibonacci sequence (0, 1, 1, 2, 3, 5, 8, 13, etc.) is a series where each number is the sum of the two preceding ones, and the ratios between these numbers (e.g., 38.2%, 50%, 61.8%) are used to predict price retracements.’

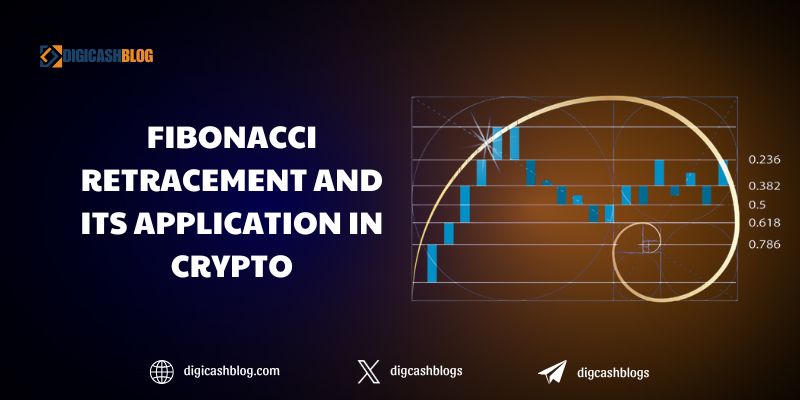
Key Levels: The most commonly used Fibonacci retracement levels are 23.6%, 38.2%, 50%, 61.8%, and 78.6%. The 50% level, while not a true Fibonacci ratio, is widely used due to its psychological significance in trading.
How It Works: Traders plot Fibonacci retracement levels by selecting a significant price swing (from a low to a high in an uptrend or vice versa) and drawing horizontal lines at the Fibonacci ratios to identify potential areas where the price may reverse or consolidate.
Crypto Relevance: In the crypto market, where price swings are often dramatic, Fibonacci retracement levels help traders pinpoint entry and exit points during pullbacks or trend continuations.
Applying Fibonacci Retracement in Crypto Analysis
The application of Fibonacci retracement in crypto analysis is particularly effective due to the market’s tendency to follow predictable patterns despite its volatility.
Identifying Support and Resistance: During a Bitcoin uptrend, for example, a trader can draw Fibonacci retracement levels from the swing low to the swing high. If the price pulls back to the 61.8% level and holds, it may act as a strong support zone, signaling a potential buying opportunity.
Trend Continuation: Fibonacci levels can also indicate where a price might pause before continuing in the direction of the primary trend. For instance, if Ethereum retraces to the 38.2% level during an uptrend and then resumes upward movement, this level can confirm trend strength.
Crypto-Specific Considerations: Cryptocurrencies often experience rapid price spikes driven by news or market sentiment. Fibonacci retracement can help traders distinguish between temporary pullbacks and major reversals by focusing on key levels.
Combining Fibonacci Retracement with Other Indicators
To enhance the accuracy of Fibonacci retracement in crypto analysis, traders often combine it with other technical indicators for confirmation.
With RSI: The Relative Strength Index (RSI) can confirm overbought or oversold conditions at Fibonacci levels. For example, if Solana’s price retraces to the 50% Fibonacci level and RSI indicates an oversold condition (below 30), it strengthens the case for a potential reversal.
With MACD: The Moving Average Convergence Divergence (MACD) can validate trend direction. A bullish MACD crossover near a Fibonacci support level, such as the 61.8% level, can signal a high-probability entry point.
With Bollinger Bands: Bollinger Bands can highlight volatility at Fibonacci levels. If the price touches the 38.2% retracement level and aligns with the lower Bollinger Band, it may indicate a low-risk buying opportunity.
Advanced Strategies for Fibonacci Retracement in Crypto
Advanced traders can leverage Fibonacci retracement in crypto analysis by incorporating sophisticated techniques tailored to the crypto market’s unique dynamics.
- Fibonacci Extensions: After a retracement, traders can use Fibonacci extension levels (e.g., 161.8%, 261.8%) to project potential price targets for the next leg of a trend. For instance, if Cardano breaks above a previous high after retracing to the 50% level, the 161.8% extension could serve as a profit-taking target.
- Multi-Time Frame Analysis: Analyzing Fibonacci levels across multiple time frames (e.g., 1-hour, 4-hour, daily) provides a broader perspective. A 61.8% retracement level on a daily chart that aligns with a 38.2% level on a 4-hour chart can signal a high-probability trade setup.
- Confluence with Support/Resistance: Combining Fibonacci levels with historical support and resistance zones increases reliability. For example, if the 50% Fibonacci level coincides with a key support level on Binance Coin’s chart, it strengthens the likelihood of a bounce.

Practical Tips for Using Fibonacci Retracement
Choose Significant Swings: Select clear swing highs and lows for drawing Fibonacci levels. In crypto, avoid minor fluctuations and focus on major price movements to ensure accuracy.
Backtest Your Strategy: Test Fibonacci retracement on historical crypto data to understand how specific assets (e.g., Bitcoin, altcoins) react at key levels.
Account for Volatility: Cryptocurrencies are highly volatile, so use wider stop-loss orders to avoid being stopped out by sudden price spikes.
Incorporate Volume Analysis: High trading volume at a Fibonacci level can confirm its significance. For instance, a surge in volume at the 61.8% level suggests strong buying or selling interest.
Challenges and Limitations
While Fibonacci retracement in crypto analysis is a powerful tool, it has limitations:
- Choosing the correct swing high and low can be subjective, leading to inconsistent results among traders.
- In highly volatile markets, prices may overshoot or undershoot Fibonacci levels, generating false signals. Combining with other indicators can mitigate this risk.
- Crypto prices are heavily influenced by news, regulatory changes, and whale activity, which can override technical patterns. Always stay informed about market developments.
Fibonacci retracement in crypto analysis is a versatile and widely used tool that helps traders navigate the unpredictable cryptocurrency market. By identifying key support and resistance levels, combining with other indicators, and applying advanced strategies like extensions and multi-time frame analysis, traders can make more informed decisions. However, success requires practice, backtesting, and an understanding of the crypto market’s unique dynamics. Whether you’re trading Bitcoin, Ethereum, or altcoins, mastering Fibonacci retracement can give you a competitive edge in the fast-paced world of crypto trading.
