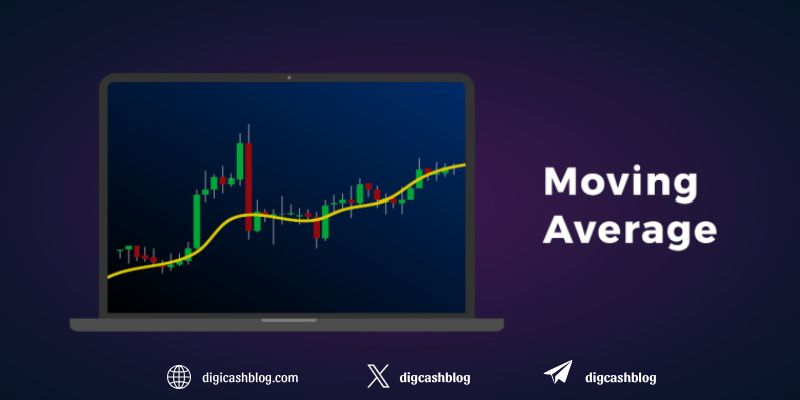
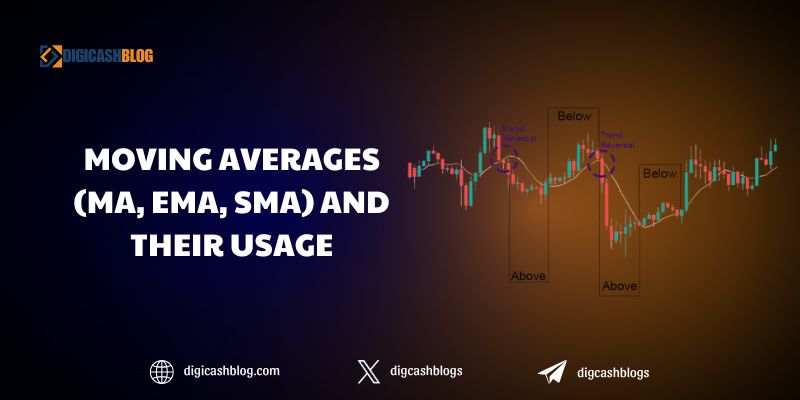
Moving Averages in crypto analysis—including the Simple Moving Average (SMA), Exponential Moving Average (EMA), and general Moving Average (MA) concepts—are fundamental for smoothing price data and spotting market trends. This article explores the mechanics of MA, EMA, and SMA, their applications in crypto trading, and strategies to leverage them effectively.
What Are Moving Averages?
A Moving Average (MA) is a technical indicator that calculates the average price of a cryptocurrency over a specified period, smoothing out price fluctuations to reveal underlying trends. Moving Averages are versatile and can be adapted to various time frames, making them suitable for both short-term and long-term trading strategies.
Types of Moving Averages:
- Simple Moving Average (SMA): Calculates the arithmetic mean of closing prices over a set period (e.g., 20-day SMA averages the last 20 days’ closing prices).
- Exponential Moving Average (EMA): Gives more weight to recent prices, making it more responsive to new market data compared to SMA.
Purpose: Moving Averages help traders identify trend direction, potential reversals, and support/resistance levels in the crypto market.
Understanding the Simple Moving Average (SMA)
The Simple Moving Average (SMA) is the most basic form of Moving Average, widely used for its simplicity and reliability in identifying long-term trends.
Calculation: SMA is computed by summing the closing prices over a chosen period and dividing by the number of periods. For example, a 50-day SMA for Bitcoin is the average of its closing prices over the past 50 days.
Interpretation: A rising SMA indicates an uptrend, while a declining SMA suggests a downtrend. Traders often use longer SMAs (e.g., 200-day) to gauge the overall market direction and shorter SMAs (e.g., 50-day) for intermediate trends.
Crypto Application: In crypto, the 200-day SMA is a key indicator for long-term investors. For instance, if Ethereum’s price is above its 200-day SMA, it’s often considered a bullish signal, encouraging buy-and-hold strategies.

Exploring the Exponential Moving Average (EMA)
The Exponential Moving Average (EMA) is designed to react more quickly to recent price changes, making it ideal for traders in the fast-moving crypto market.
Calculation: EMA applies a weighting factor to recent prices, calculated using a multiplier (e.g., 2 ÷ (period + 1)). For a 20-day EMA, recent prices have a greater impact than older ones.
Interpretation: EMAs are more sensitive to price changes, making them useful for detecting short-term trends or reversals. A crossover of a short-term EMA (e.g., 12-day) above a longer-term EMA (e.g., 26-day) signals bullish momentum.
Crypto Application: For volatile assets like Solana, EMAs are effective for day traders. A 12-day EMA crossing above a 26-day EMA could signal a short-term buying opportunity during a market rally.
Practical Applications of Moving Averages in Crypto Analysis
Moving Averages in crypto analysis are versatile tools with multiple applications:
Trend Identification: MAs help traders confirm whether a cryptocurrency is in an uptrend, downtrend, or consolidation phase. For example, if Bitcoin’s 50-day SMA is rising and the price is above it, it confirms bullish momentum.
Support and Resistance: MAs often act as dynamic support or resistance levels. For instance, during a pullback, Cardano’s price may bounce off its 50-day EMA, indicating strong support.
Crossover Strategies: A popular strategy involves using two MAs of different periods. A bullish crossover (e.g., 50-day SMA crossing above 200-day SMA) is known as a “Golden Cross,” signaling a potential long-term uptrend. Conversely, a “Death Cross” (50-day SMA crossing below 200-day SMA) indicates a bearish trend.
Crypto-Specific Use: In altcoin markets, where prices can be influenced by Bitcoin’s movements, MAs help traders filter noise and focus on sustained trends. For example, a Golden Cross on Chainlink’s chart may signal a breakout, especially if Bitcoin is also bullish.
Combining Moving Averages with Other Indicators
To maximize the effectiveness of Moving Averages in crypto analysis, traders often combine them with other technical indicators:
- With RSI: The Relative Strength Index (RSI) can confirm momentum at MA crossovers. For example, a bullish EMA crossover combined with an RSI below 30 suggests a strong buying opportunity.
- With Bollinger Bands: MAs form the basis of Bollinger Bands (typically a 20-day SMA). If a cryptocurrency’s price touches the lower Bollinger Band and the 20-day SMA acts as support, it may indicate a reversal.
- With MACD: The MACD, which uses EMAs, complements MA strategies. A bullish MACD crossover aligned with a Golden Cross strengthens the case for entering a long position.

Advanced Strategies for Moving Averages in Crypto
Advanced traders can enhance their use of Moving Averages in crypto analysis with tailored strategies:
- Dual EMA Strategy: Use a fast EMA (e.g., 12-day) and a slow EMA (e.g., 26-day) for short-term trading. A crossover signals entry or exit points, especially in high-volatility coins like Dogecoin.
- Multi-Time Frame Analysis: Combine MAs across different time frames. For instance, a 50-day SMA on a daily chart confirming a bullish trend, paired with a 12-day EMA crossover on a 4-hour chart, can provide a high-probability trade setup.
- Dynamic Stop-Loss: Use a short-term MA (e.g., 20-day EMA) as a trailing stop-loss to lock in profits during trending markets. For example, if trading Binance Coin, exit the position if the price falls below the 20-day EMA.
Moving Averages in crypto analysis, including SMA and EMA, are indispensable tools for navigating the volatile cryptocurrency market. By identifying trends, acting as dynamic support/resistance, and enabling crossover strategies, MAs provide traders with actionable insights. Combining them with other indicators like RSI, MACD, or Bollinger Bands enhances their effectiveness, while advanced strategies like multi-time frame analysis and dynamic stop-losses cater to experienced traders. Despite their limitations, with proper application and risk management, Moving Averages can significantly improve trading outcomes in the dynamic world of crypto.
