Volume analysis in crypto trading stands out as a critical method for predicting price trends and assessing market strength. Trading volume, which represents the total number of assets traded over a specific period, provides insights into market sentiment, momentum, and potential reversals. As of 2025, with the crypto market cap at $2.66 trillion, understanding volume analysis is essential for both retail and institutional traders. This article explores how trading volume can predict trends, its applications, and strategies for leveraging it effectively in crypto markets.
What is Volume Analysis?
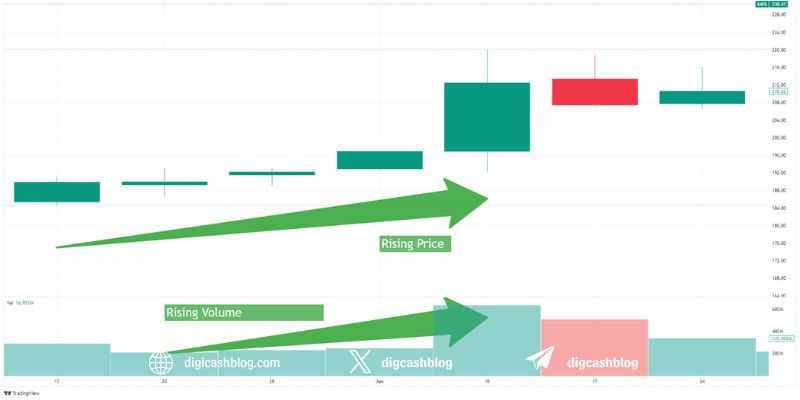
Volume analysis involves studying the trading volume of a cryptocurrency to gauge the strength or weakness of price movements. High volume often indicates strong market participation, while low volume may signal indecision or lack of conviction. Volume is typically displayed as a histogram beneath price charts on platforms like TradingView or Binance.
Key Metrics:
- Spot Volume: Represents direct buying and selling on exchanges, reflecting genuine market interest.
- On-Chain Volume: Tracks transactions on the blockchain, providing insights into network activity (e.g., Bitcoin transfers).
- Derivatives Volume: Includes futures and options trading, often amplifying spot market trends.
- Significance: Volume confirms price trends, validates breakouts, and signals potential reversals, making it a cornerstone of technical analysis in crypto.

How Volume Predicts Trends in Crypto Trading
Volume analysis in crypto trading helps traders identify the sustainability of price movements and predict future trends:
Trend Confirmation: Rising volume during a price uptrend suggests strong buying pressure, indicating the trend is likely to continue. For example, if Bitcoin’s price rises with increasing volume, it confirms bullish momentum.
Breakout Validation: A breakout above a resistance level with high volume is more reliable than one with low volume. For instance, a surge in Solana’s price above a key resistance with spiking volume signals a potential bullish continuation.
Reversal Signals: Divergences between price and volume can indicate reversals. If Ethereum’s price hits a new high but volume decreases, it may suggest weakening momentum, hinting at a potential pullback.
Crypto-Specific Context: The crypto market’s volatility, driven by news, whale activity, or sentiment on platforms like X, makes volume analysis crucial for filtering noise and identifying genuine trends.
Combining Volume Analysis with Other Indicators
To enhance the accuracy of volume analysis in crypto trading, traders often combine it with other technical indicators:
With Moving Averages (MA): Volume spikes aligning with a bullish crossover (e.g., 50-day SMA crossing above 200-day SMA) strengthen trend signals. For example, a Golden Cross in Cardano with high volume confirms a robust uptrend.
With RSI: The Relative Strength Index (RSI) can validate volume-driven signals. A high-volume breakout with an RSI below 70 suggests room for further upside, while an overbought RSI (above 70) with low volume may indicate a false breakout.
With Bollinger Bands: High volume near the upper or lower Bollinger Band can signal a breakout or reversal. For instance, if XRP’s price touches the lower Bollinger Band with rising volume, it may indicate a buying opportunity.
Advanced Volume Analysis Strategies
Advanced traders can leverage volume analysis in crypto trading with sophisticated techniques tailored to the crypto market:
On-Balance Volume (OBV): OBV cumulates volume based on price direction, rising when prices close higher and falling when prices close lower. A rising OBV with a flat price in Binance Coin could signal accumulation, predicting an upcoming breakout.
Volume-Weighted Average Price (VWAP): VWAP calculates the average price weighted by volume, acting as a dynamic support/resistance level. Traders use VWAP to assess whether a cryptocurrency like Dogecoin is trading above or below its “fair” value intraday.
Volume Profile: This tool shows volume distribution across price levels, identifying high-volume nodes (support/resistance zones). For Bitcoin, a high-volume node at $90,000 may act as strong support during a pullback.
Crypto-Specific Application: On-chain volume analysis, using tools like Glassnode, can reveal whale activity or network adoption. For example, a spike in Ethereum’s on-chain volume during a price dip may indicate institutional buying.
Volume Analysis in 2025 Crypto Market Trends
Recent posts on X and market data highlight the relevance of volume analysis in 2025:
- Institutional Activity: With $15 billion in Bitcoin ETF assets managed by BlackRock, high spot volume in ETFs signals institutional buying, reinforcing bullish trends.
- Stablecoin Dominance: Stablecoin transfer volumes are projected to hit $300 billion daily by year-end, stabilizing markets and amplifying spot volume signals for assets like USDT or USDe.
- Altcoin Surges: Altcoins like Solana and XRP see volume spikes during DeFi or cross-border payment adoption, as noted in X discussions, indicating breakout potential.

Challenges and Limitations
Despite its utility, volume analysis in crypto trading has limitations:
- Wash Trading: Some exchanges inflate volume through wash trading, distorting signals. Traders should rely on reputable exchanges or on-chain data for accuracy.
- Low-Liquidity Markets: Altcoins with low volume can produce misleading signals, requiring confirmation from other indicators.
- External Influences: Sudden news (e.g., regulatory changes) or whale-driven pumps can override volume signals, as seen in Q1 2025 price swings after U.S. tariff announcements.
Practical Tips for Using Volume Analysis
- Verify Volume Sources: Use trusted platforms like CoinMarketCap or on-chain analytics (e.g., Glassnode) to avoid manipulated volume data.
- Combine with Price Action: Confirm volume spikes with candlestick patterns (e.g., engulfing candles) for higher-probability trades.
- Monitor On-Chain Data: Analyze on-chain volume for insights into network activity, especially for assets like Ethereum or Cardano.
- Backtest Strategies: Test volume-based strategies on historical data to evaluate effectiveness for specific cryptocurrencies.
- Risk Management: Use stop-loss orders to protect against sudden volatility, especially in low-volume altcoin markets.
Volume analysis in crypto trading is a powerful tool for predicting trends, validating breakouts, and identifying reversals in the dynamic cryptocurrency market. By combining volume with indicators like Moving Averages, RSI, and Bollinger Bands, traders can enhance their decision-making process. In 2025, with institutional adoption, stablecoin growth, and altcoin surges driving market dynamics, volume analysis remains a cornerstone of effective trading strategies.
However, traders must navigate challenges like wash trading and external market influences by using reliable data sources and robust risk management. By mastering volume analysis, traders can gain a competitive edge in the ever-evolving crypto landscape.
